Introducing the New Reporting Suite in ‘Experiences’ by Click4Assistance
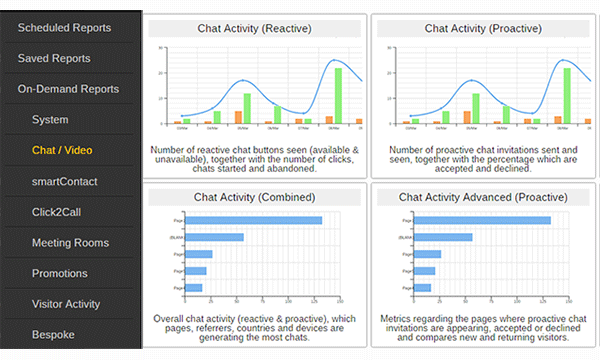
The new enhanced solution welcomes a refreshing uplift to the reporting suite. The module introduces easier functionality to run, view and export data, and a range of graphs and tables for more in-depth reporting.
Before fully switching over from the Toolbox to Experiences it is important for your analysts to benchmark your existing data to continue measuring your Return on Investment (ROI). This should include your operators productivity as swapping over to a new system could cause impact therefore your supervisors can identify which representatives may need extra support and/or training.
Running Reports
Analysts can run reports on demand and customise them to fit their requirements selecting:
- The date range and various filters
- Columns of data for table reports
- Data series that display on the graph reports
Once the required filters have been selected, analysts have a choice on how they wish to use the data. They can view the information on screen within the solution if they want to glance at the data without recording it anywhere. When viewing a large amount of data the user can click and drag the section on the graph to enlarge an area of interest. The report can be saved in the solution to view as and when the analyst requires it or can be printed directly from viewing an on demand or saved report.
Reports can be exported in various formats, as a pdf to present the data or as an Excel or CSV file to be able to manipulate the data into other company reports. If the organisation wants to report on the data regularly then analysts can schedule the report to send daily, weekly or monthly in the preferred format to their email address, this helps analysts to access the information easily without having to log into Experiences.
Structuring the Reports
Reports are segmented into relevant areas to make it easier for analysts or supervisors to access the report(s) they require, this includes:
- System (Account and Availability data)
- Chat / Video (Activity and performance data relating to web and video chat)
- smartContact (Activity and details relating to smartContact forms)
- Click2Call (Activity and performance details relating to Click2Call)
- Promotions (Activity data)
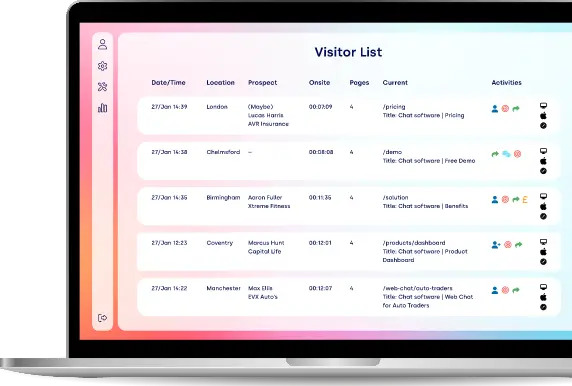
- Visitor Activity (Journey, conversion and activity data relating to visitor behaviour)
- Bespoke (Any reports created by our team specifically for your account will display here)
Within each segment there are multiple reports, each report is made up of relevant data to make it easy to analyse and perceive any correlations e.g. visitors are accepting more promotions this month and therefore we have seen an increase in the number of pages they are viewing.
Examples
There is a vast amount of data available within the reporting suite and it will be your organisation that needs to decide what metrics are the most useful for your analysts to collect. Here are a couple of examples of the more popular reports:
System – Account Overview
The Account Overview report combines valuable information including a snapshot of basic tool information and website activity. This report allows analysts to measure the performance of the account and compare with baseline indicators.
Your Account
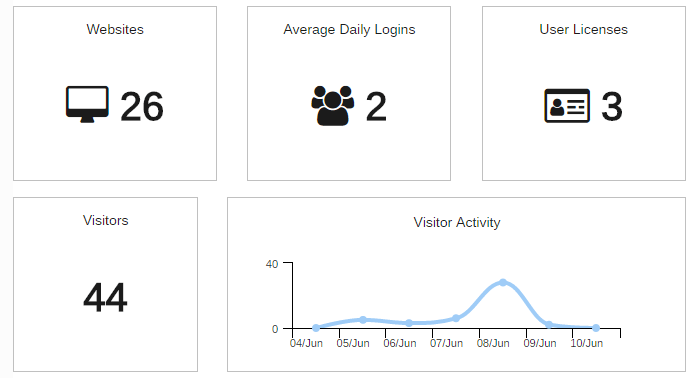
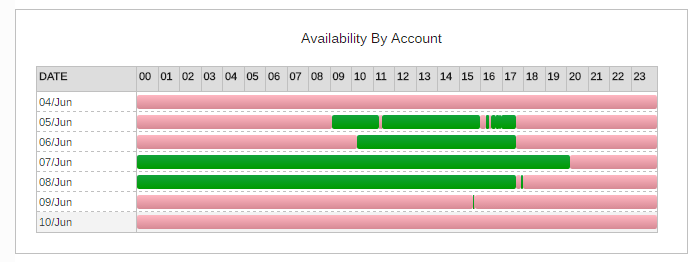
These sets of data are some of the more popular metrics organisations want to know from their ‘Experiences’ account, their website coverage and audience. The Account Overview makes it easy for companies to view the data quickly.
Total Chats and Chat Volume Data

The number of total chats and the daily breakdown of chat volume enables the company to see if they are attracting visitors to chat and to investigate further if the level is not as expected, for example, were too many representatives unavailable through the day, and if so what was the reason? Analysts can view other reports that contain data relating to the snapshot to locate the cause.
Top Performing Operator

This metric shows companies which operator is handling the most chats, this may be the same representative every week if a user has been selected as the first contact to answer incoming chats. Alternatively, organisations can use this figure to reward and motivate their staff for being the best live chat operator over the week, month, year etc.
Offline Request / Offline Button seen

Being able to gauge how many times your unavailable button has been seen and the requests received allow your businesses to identify room for potential improvements. If your organisation is getting too many missed opportunities, you can consider increasing the availability of chat or number of users.
Your Experiences
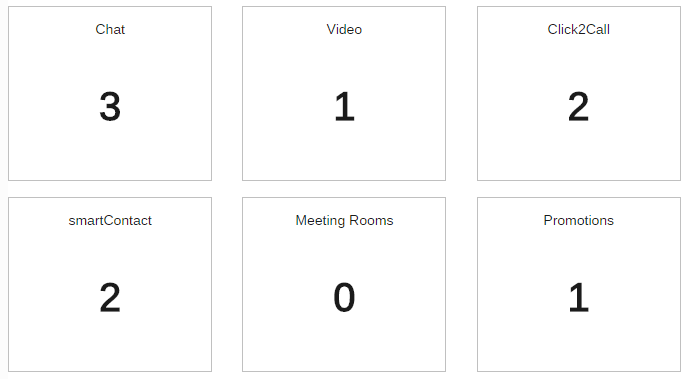
Find out which of the communication channels is your visitors preferred method of contact and focus on improving the ones providing the most engagement.
Chat / Video – Chat Performance Summary
This summary report shows total and average response times and durations.

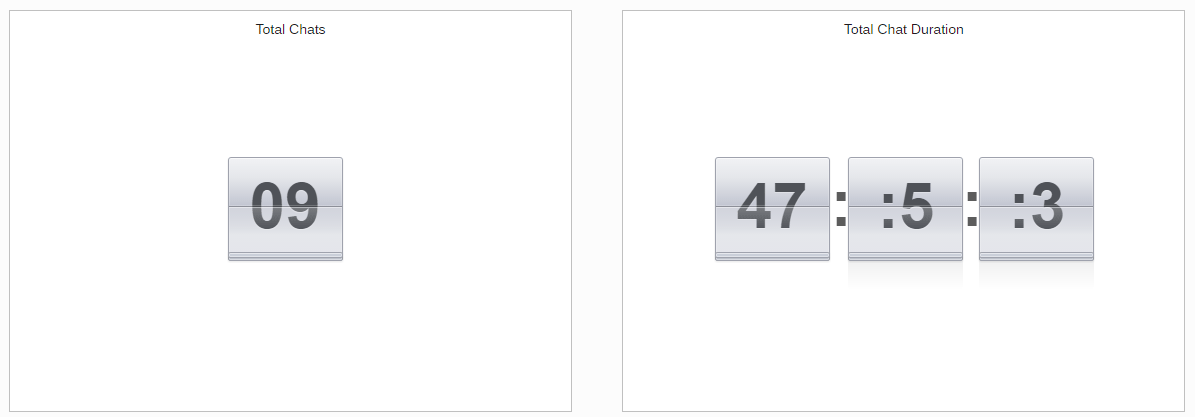
Organisations that have a call centre environment may have targets in place for the length of the chat. This report can be used to monitor if the duration is meeting the target for the number of chats that occur.

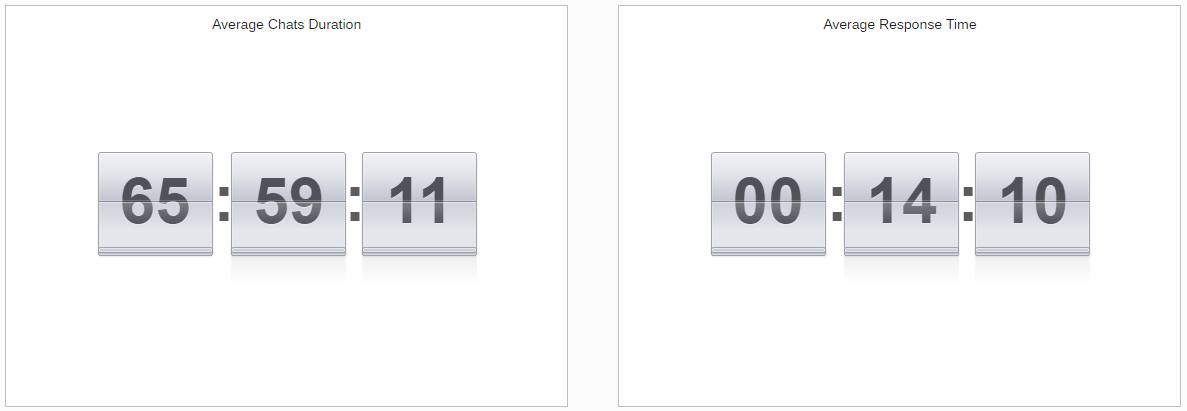
To keep visitors satisfied in chat ensure they are being responded to in a timely manner and identify any areas for improvement.
More Information
There are over 50 reports in the new reporting suite and the above examples are just two of the ones available. Your analysts can improve any aspect of engaging with website visitors with the data provided in the reporting suite, whether that is identifying training areas for operators, amending your proactive invitation timings or increasing the hours your chat is available for.
To keep up with the latest news of Experiences ensure your details are up to date in the Click4Assistance solution, or to be added to our newsletters email theteam@click4assistance.co.uk with your contact details.

